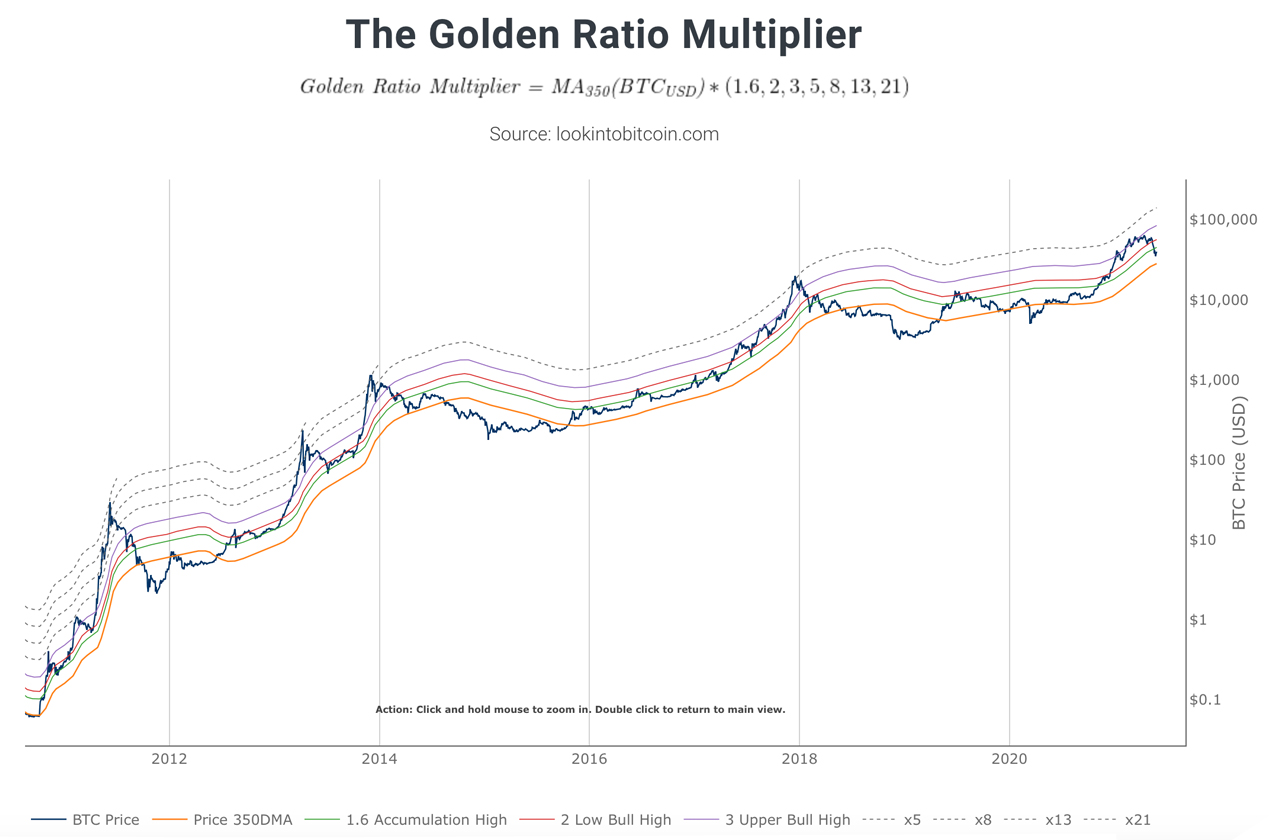
The leading crypto asset bitcoin has seen its value drop more than 53% from its all-time high above the $64k handle, sliding to a low of $30k on May 19. While bitcoin is still down 25% during the last 30 days, it’s hard to forecast where bitcoin’s value is going from here. Although a number of people leverage indicators like the Golden Ratio Multiplier, Fibonacci sequence, logarithmic growth curves, and tools such as the infamous stock-to-flow (S2F) price model to predict future bitcoin valuations.
Predicting Bitcoin’s Booms and Busts With the Number Phi
Most people can’t predict the future and when it comes to bitcoin (BTC) and the crypto economy, in general, busts and booms are common. Moreover, lots of times busts and booms are unpredictable except for a few occasions like specific news stories that shake investors. However, there’s a plethora of technical analysis tools, charts, and models that help a great number of people get ahead of the game.

For instance, fans of technical analysis leverage the perspective of the golden ratio and Fibonacci sequence in order to predict future bitcoin valuations. Essentially a trader will apply mathematics to things like bitcoin’s value and moving averages. The golden ratio is also known as divine section, divine proportion, the number phi, extreme and mean ratio, and the golden number. Essentially in the “science of quantity,” two quantities reach a mathematical divine section when their ratio is equal to the ratio of their sum to the larger of the two quantities.

The golden ratio is equal to 1.618 and it’s not only used in mathematics, but it also appears in architecture, geometry, and many natural elements. Then there’s the classical example of mathematics called the Fibonacci sequence, which is a sequence of quantities where a number is the addition of the last two quantities, starting with 0, and 1. The Golden Ratio Multiplier hosted on lookintobitcoin.com gives a detailed description of how the multiplier works with the leading crypto asset bitcoin (BTC).
“Bitcoin’s adoption curve and market cycles to understand how price may behave on medium to long term time frames,” the website notes. “To do this it uses multiples of the 350 day moving average (350DMA) of Bitcoin’s price to identify areas of potential resistance to price movements.” Lookintobitcoin.com further adds:
Multiples are of the 350DMA’s price values rather than its number of days. The multiples reference the Golden Ratio (1.6) and the Fibonacci sequence (0, 1, 1, 2, 3, 5, 8, 13, 21). These are important mathematical numbers. These specific multiplications of the 350DMA have been very effective over time at picking out intracycle highs for Bitcoin price and also the major market cycle highs.
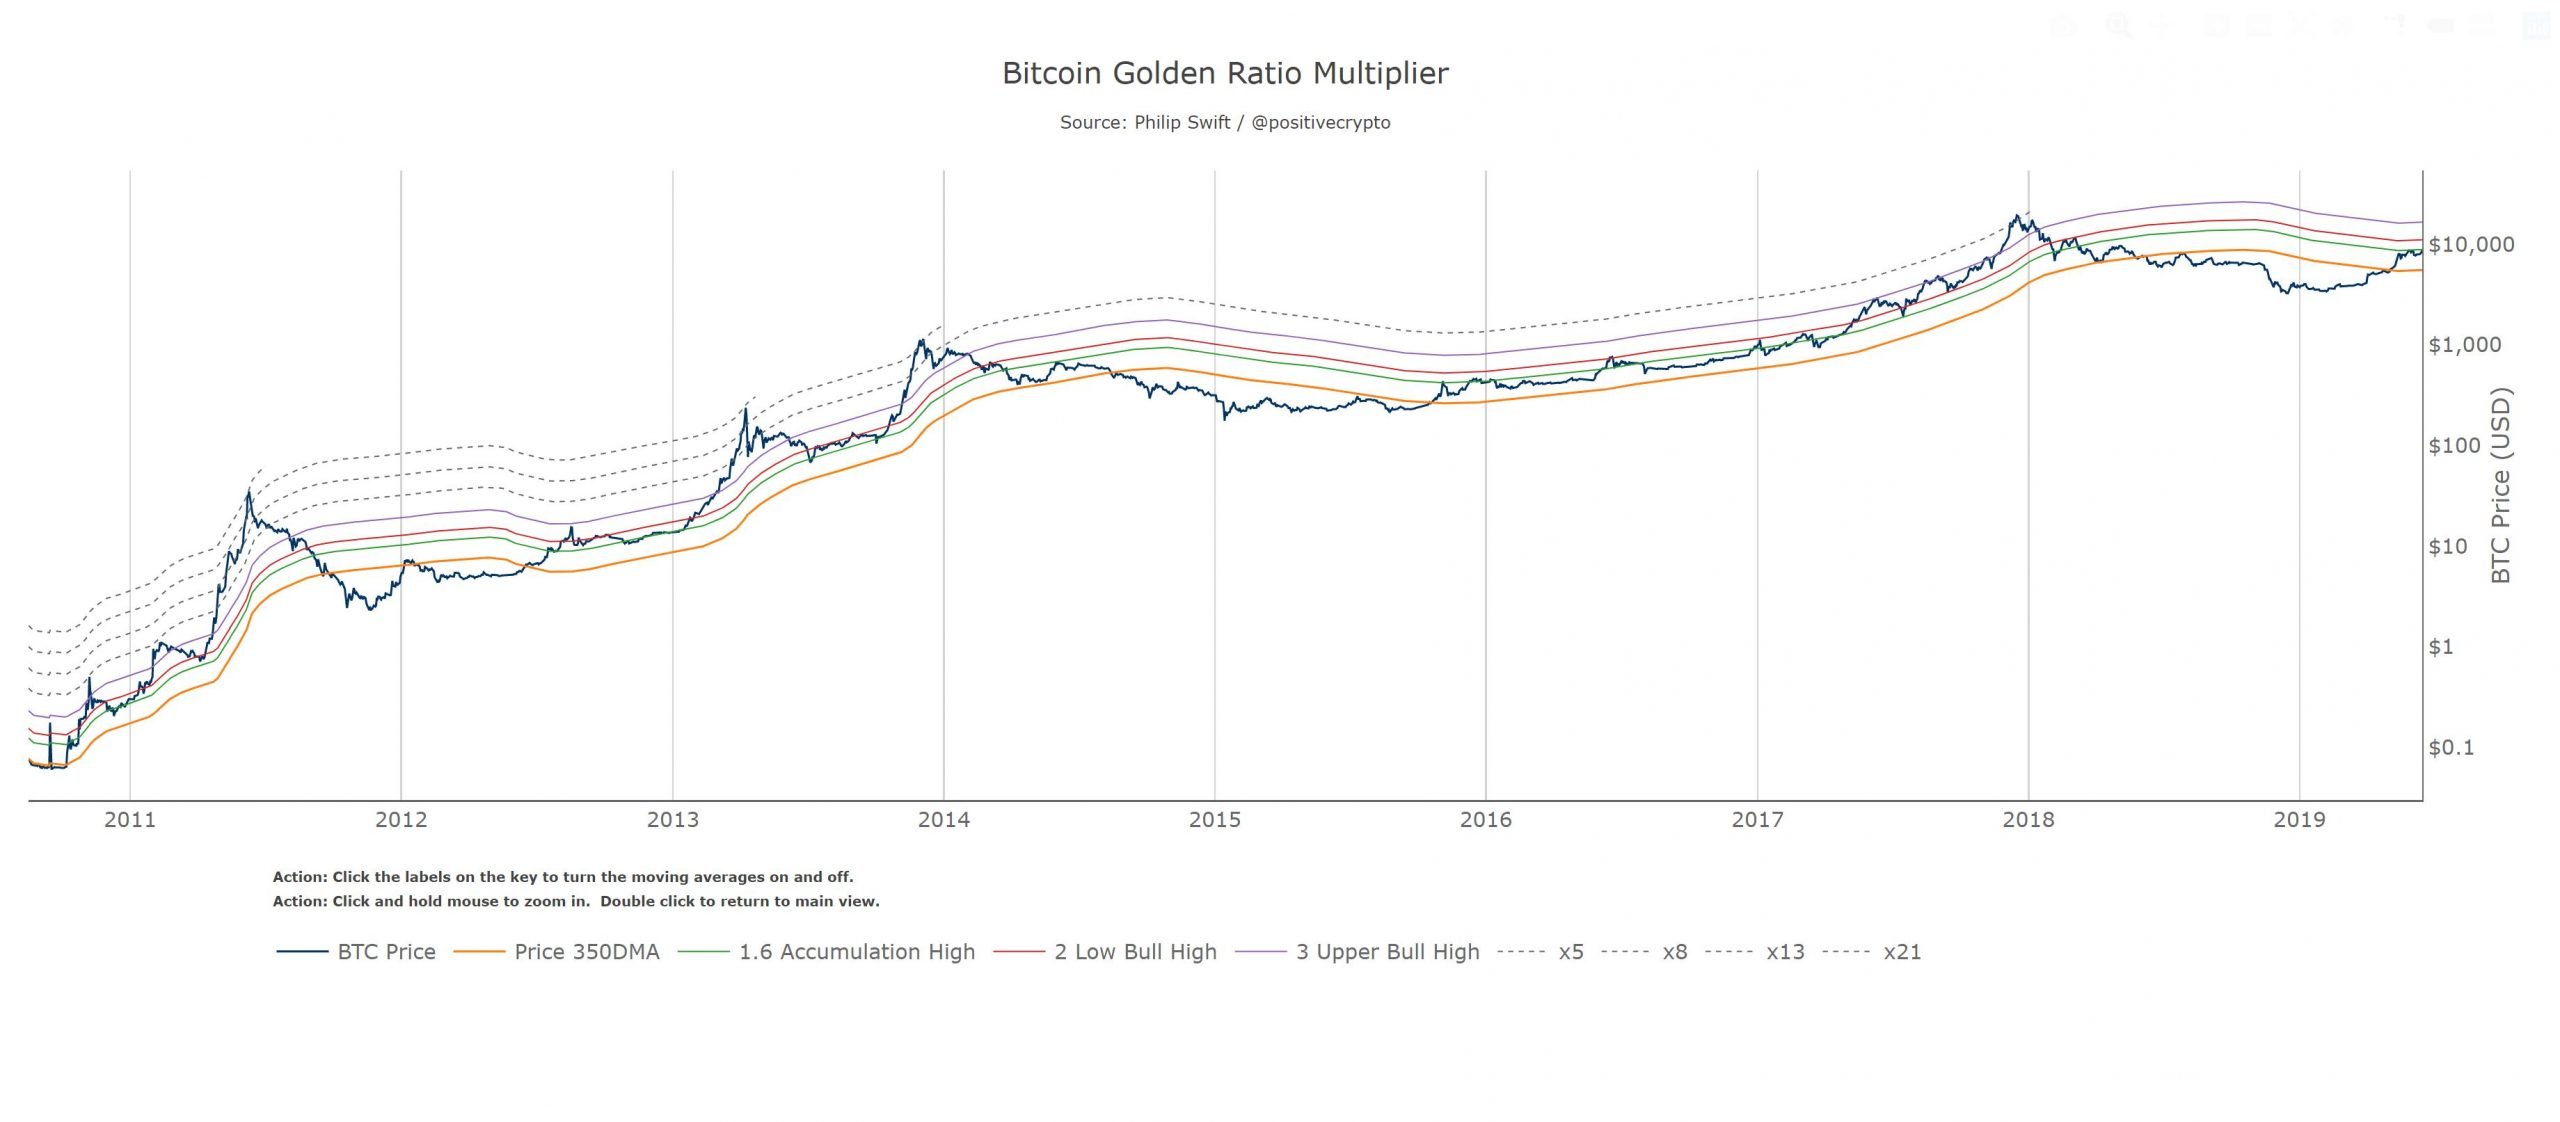
The Golden Ratio Multiplier, as it is applied to bitcoin price predictions, was invoked by Philip Swift when he published an article on the subject on June 17, 2019. The article titled: “The Golden Ratio Multiplier: Unlocking the mathematically organic nature of Bitcoin adoption,” helps a trader get more perspective on multi-year cycles.

“The article starts by noting how the 350-day moving average has acted as an axis for Bitcoin’s major market cycles – once we break out, a new BTC bull run begins,” Swift tweeted two years ago. Swift continued further by saying:
The new insight begins when that important moving average is multiplied by key numbers: the golden ratio (1.618) and numbers in the Fibonacci sequence (1,2,3,5,8,13,21). In doing so we are able to pick out almost all the major intracycle price highs in Bitcoin’s history (coloured lines) AND each market cycle top (dotted lines). See 2015-17 bull run as a clear example of the MA multipliers acting as major resistance at the intracycle highs.
Bitcoin’s Numerical Sequence Like Fibonacci Poetry and Nautilus Shells
Of course, not everyone agrees with using the golden ratio and the Fibonacci sequence to predict bitcoin busts and booms. For instance, Alvaro Fernández from the open insurance platform Nsure Network remarked: “Historically it seemed to be respected, but how much could you trust it? We might as well pass through the first accumulation high.” Other critics believe using the golden ratio and the Fibonacci sequence is no different than using tarot cards.

Despite the skeptics, Swift’s bitcoin tool the Golden Ratio Multiplier is well respected and used by a myriad of technical analysts. The golden ratio has been utilized since the time of the ancient Greeks and many believe it’s deeply associated with the universe and nature. Similar to the golden ratio, Satoshi Nakamoto’s invention is a renowned and irrational technology by design. Interestingly, bitcoin’s epic price rise since it was first traded has followed the number phi and Fibonacci sequence patterns intimately.
In the same way as the Golden Ratio Multiplier, the leading asset has followed succinctly with a “natural long-term power-law corridor of growth,” according to Harold Christopher Burger. Burger published a comprehensive article that discusses bitcoin’s logarithmic growth curves. Like Swift’s Golden Ratio Multiplier, logarithmic growth curves can also give a trader an idea of when they can expect busts and booms and specific time frames. But these tools have allegedly been debunked on occasion and the golden ratio is often considered a fairytale.
Similar to the Nautilus shell, bitcoin’s price has often been associated with the golden mean and Fibonacci sequence. The Nautilus shell is often compared and associated with the golden ratio, but contrarian research and further considerations say that the famous shell is not a good example of the golden ratio logarithmic spiral found in nature. Studies show the Nautilus shell has phi proportions but follows a 4:3 ratio.
What do you think about using the golden ratio and Fibonacci sequence to predict future bitcoin prices? Let us know what you think about this subject in the comments section below.
source https://news.bitcoin.com/spiral-out-using-the-golden-ratio-and-fibonacci-sequence-to-predict-bitcoin-price-cycles/
EmoticonEmoticon